If one starts to use OMP analysis the first and fundamental problem that arises is the definition of the water masses for the mixing model. A rather incomplete collection of water masses is given here, separated into ocean basins, which will help to find the water involved in your studies.
The procedure for defining source water masses depends on the nature of the problem. You have to keep in mind that the solution procedure of OMP analysis will find a result even if you use definitions from a different ocean. Please inspect the residuals carefully to find shortcomings in your water mass definitions.
An important point to remember is that you should define source water masses in terms of physical processes (see Tomczak, 1999, for further information). Heuristic assumptions, such as plotting all data and finding vertices or endpoints of mixing lines, can sometimes be used if they can be justified in terms of physcal processes. In general, the vertex strategy has only merit in local studies.
Using local end members, the interpretation of biogeochemical cycling parameters such as the "age" in the extended OMP analysis is only possible in terms of ratios (eg. Hupe and Karstensen, 2000 ). Absolute cycling parameters (total change in oxygen or carbon) cannot be deduced as well, as one has to be careful in applying the fractions to reconstruct the undiluted content of anthropogenic tracers. For those studies a "preformed" definition of the source waters in their physical formation region is strongly recommended. If this is not done a preformed correction is necessary, and this again has to be made in relation to the ventilation sites (eg. the winter outcrop for the Central Waters), which implies the use of "real" ventilating water masses.
Please contribute your water mass definition values to our collection to improve further studies and to make the application of OMP analysis easier for "novices". If you SUBMIT your definition: Please send data in appropriate units (see above). At least for local definitions provide a map - the ocean is quite large!!
The following tables are separated into preformed and local definitions.
| water mass name/submitted by | characteristic | usage (local, preformed, map??) | author/year | remarks (eg. definition method) |
|---|---|---|---|---|
| North Atlantic Central Water (NACW) matthias.tomczak@flinders.edu.au |
ptemp = 6.9973 - 13.9022 sal = 34.9424 - 35.8986 oxy = 291.6402 - 252.1236 ph = 0.4640 - 0.1922 ni = 5.8223 - 0.0869 si = 3.8627 - 1.7944 |
preformed, based on World Ocean Atlas 1994 | Poole and Tomczak (1999) | derived from surface mixed layer data in formation region |
| Western South Atlantic Central Water (WSACW) matthias.tomczak@flinders.edu.au |
ptemp = 6.5519 - 16.2664 sal = 34.4017 - 35.6921 oxy = 295.4140 - 239.5682 ph = 1.1156 - 0.2014 ni = 13.3263 - 0.0 si = 4.1156 - 1.6779 |
preformed, based on World Ocean Atlas 1994 | Poole and Tomczak (1999) | derived from surface mixed layer data in formation region |
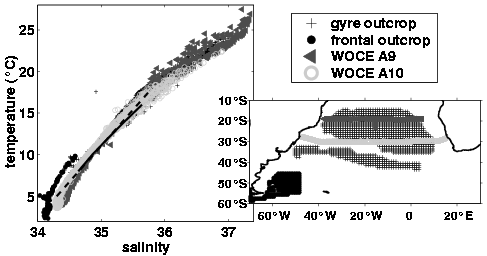
| South Atlantic Central Water (SACW) jkarstensen@ifm.uni-kiel.de |
ptemp = 25 - 5 - 3 sal = 37.1 - 34.1 - 34.1 oxy = 205 - 305 - 180 ph = 0.25 - 1.05 - 2.1 ni = 0 - 19 - 35 si = 1.5 - 7.3 - 75 |
preformed, based on
World Ocean Atlas 1994
Here is a map and a TS diagramm |
Karstensen and Quadfasel (2000, submitted) | derived from dynamic of the mixed layer and winter data along mixed layer surface |
| water mass name/submitted by | characteristic | usage (local, preformed, map??) | author/year | remarks (eg. definition method) |
|---|---|---|---|---|
| Eastern South Atlantic Central Water (ESACW) matthias.tomczak@flinders.edu.au< /A> |
ptemp = 5.9559 - 14.4067 sal = 34.4069 - 35.3016 oxy = 300.0553 - 249.3363 ph = 1.3083 - 0.2360 ni = 11.7672 - 0.0 si = 7.0952 - 3.6276 |
treated as a water mass imported from the Indian Ocean by the Agulhas Current, based on World Ocean Atlas 1994 | Poole and Tomczak (1999) | derived from vertical profile data south of Africa |
| Western North Atlantic Central Water (WNACW) matthias.tomczak@flinders.edu.au< /A> |
ptemp = 7.00 - 19.00 sal = 35.00 - 36.65 oxy = 165.4 - 235.3 ph = 1.30 - 0.15 ni = 20.00 - 2.00 si = 15.00 - 2.00 |
temperature and salinity from Emery and Meincke (1986), nutrients from GEOSECS (Bainbridge, 1976) | Hinrichsen and Tomczak (1999) | derived from source regions; close to preformed? |
| Antarctic Intermediate Water (AAIW) matthias.tomczak@flinders.edu.au< /A> |
ptemp = 3.5 sal = 34.55 oxy = 165.2 ph = 2.3 ni = 33.0 si = 45.0 |
data from GEOSECS (Bainbridge, 1976) | Hinrichsen and Tomczak (1999) | derived from data at depth in the southern hemisphere |
| North Atlantic Deep Water (NADW) matthias.tomczak@flinders.edu.au< /A> |
ptemp = 3.5 sal = 34.945 oxy = 271.8 ph = 1.1 ni = 17.6 si = 11.0 |
own data from the study region Hinrichsen and Tomczak (1999) | Hinrichsen and Tomczak (1999) | data from the north western part of the study region |
| Western Atlantic Subarctic Intermediate Water (WASIW) matthias.tomczak@flinders.edu.au< /A> |
ptemp = 3.7 sal = 34.8 oxy = 271.8 ph = 1.1 ni = 17.0 si = 10.0 |
own data from the study region Hinrichsen and Tomczak (1999) | Hinrichsen and Tomczak (1999) | data from the north western part of the study region |
| Labrador Current Water (LCW) matthias.tomczak@flinders.edu.au< /A> |
ptemp = -0.28 sal = 33.33 oxy = 358.76 ph = 0.6 ni = 4.7 si = 4.3 |
own data from the study region Hinrichsen and Tomczak (1999) | Hinrichsen and Tomczak (1999) | data from the north western part of the study region |
| Mediterranean Water (MW) matthias.tomczak@flinders.edu.au< /A> |
ptemp = 13.2 sal = 37.72 oxy = 200.0 ph = 0.65 ni = 9.1 si = 6.5 |
station data from Rhein and Hinrichsen (1999) | Hinrichsen and Tomczak (1999) | data from the outflow region in the Gulf of Cadiz |
| water mass name/submitted by | characteristic | usage (local, preformed, map??) | author/year | remarks (eg. definition method) |
|---|---|---|---|---|
| Indian Central Water (ICW)
jkarstensen@ifm.uni-kiel.de |
ptemp = 20 - 13 - 9 sal = 36.0 - 35.25 - 34.65 oxy = 227 - 244 - 268 ph = 0.1 - 0.35 - 0.85 ni = 0 - 1 - 7 si = 2.5 - 2.5 - 2.5 |
preformed, based on
World Ocean Atlas 1994
Here is a map and a TS diagramm |
Karstensen and Quadfasel (2000, submitted) | derived from dynamic of the mixed layer and winter data along mixed layer surface, biogeochemical cycling information deduceable |
| Austral Asian Intermediate Water (AAMW)
jkarstensen@ifm.uni-kiel.de |
ptemp = 20 - 13 - .4 sal = 34.65 - 34.65 - 34.55 oxy = 91 - 91 - 1 00 ph = 2.1 - 2.1 - 1.4 ni = 30 - 30 - 19 si = 40 - 48 - 25 |
Inflow from the Indonesian Seas into
the Indian Ocean Here is a station map |
Karstensen (1999) | vertex from property/property plots in the Timor Sea (inflow region), biogeochemical cycling information NOT deduceable |
| water mass name/submitted by | characteristic | usage (local, preformed, map??) | author/year | remarks (eg. definition method) |
|---|---|---|---|---|
| Antarctic Intermediate Water (AAIW)
jkarstensen@ifm.uni-kiel.de |
ptemp = 4.5 sal = 34.35 oxy = 210 ph = 2.2 ni = 32 si = 35 |
local, valid north of 30źS | Karstensen (1999) | statistical analysis of WOCE line I5 data |
| water mass name/submitted by | characteristic | usage (local, preformed, map??) | author/year | remarks (eg. definition method) |
|---|---|---|---|---|
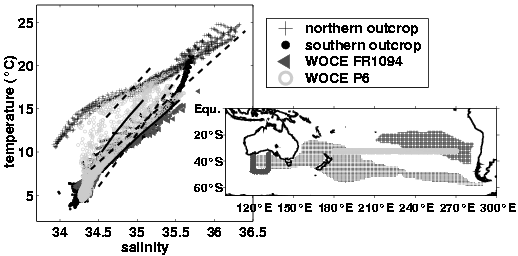
| South Pacific Central Water (N-SPCW) Eastern Outcrop (see map) jkarstensen@ifm.uni-kiel.de |
ptemp = 22 - 17 - 12 sal = 36.07 - 34.84 - 34.0 oxy = 218 - 236 - 260 ph = 0.7 - 0.3 - 0.6 ni = 0 - 0.3 - 10.3 si = 1.1 - 0.4 - 4.4 |
preformed, based on
World Ocean Atlas 1994
Here is a map of the outcrop regions and a TS diagramm |
Karstensen and Quadfasel (2000, submitted) | derived from dynamic of the mixed layer and winter data along mixed layer surface |
| South Pacific Central Water (S-SPCW) Western outcrop jkarstensen@ifm.uni-kiel.de |
ptemp = 19.4 - 5.8 - 2.5 sal = 35.66 - 34.28 - 34.17 oxy = 210 - 280 - 178 ph = 0.3 - 1.5 - 2.4 ni = 1.3 - 20.7 - 34.2 si = 1.1 - 6.4 - 49.4 |
preformed, based on
World Ocean Atlas 1994
Here is a map of the outcrop and a TS diagramm |
Karstensen and Quadfasel (2000, submitted) | derived from dynamic of the mixed layer and winter data along mixed layer surface |
| water mass name/submitted by | characteristic | usage (local, preformed, map??) | author/year | remarks (eg. definition method) |
|---|---|---|---|---|
|
|
ptemp = sal = oxy = ph = ni = si = |
| water mass name/submitted by | characteristic | usage (local, preformed, map??) | author/year | remarks (eg. definition method) |
|---|---|---|---|---|
| ptemp = sal = oxy = ph = ni = si = |
| water mass name/submitted by | characteristic | usage (local, preformed, map??) | author/year | remarks (eg. definition method) |
|---|---|---|---|---|
| ptemp = sal = oxy = ph = ni = si = |